Question: Draw the titration curve of protein YKVTA and determine its pI. A pK table of the 20 common amino acids is provided below.
|
Name
|
pK
|
pI
at 25°C
|
|
pK
α-CO2H
|
pK
NH3
|
pK
R-group
|
|
Alanine
|
2.35
|
9.87
|
|
6.11
|
|
Arginine
|
2.18
|
9.09
|
13.2
|
10.76
|
|
Asparagine
|
2.18
|
9.09
|
13.2
|
10.76
|
|
Aspartic Acid
|
1.88
|
9.60
|
3.65
|
2.98
|
|
Cysteine
|
1.71
|
10.78
|
8.33
|
5.02
|
|
Glutamic Acid
|
2.19
|
9.67
|
4.25
|
3.08
|
|
Glutamine
|
2.17
|
9.13
|
|
5.65
|
|
Glycine
|
2.34
|
9.60
|
|
6.06
|
|
Histidine
|
1.78
|
8.97
|
5.97
|
7.64
|
|
Isoleucine
|
2.32
|
9.76
|
|
6.04
|
|
Leucine
|
2.36
|
9.60
|
|
6.04
|
|
Lysine
|
2.20
|
8.90
|
10.28
|
9.47
|
|
Methionine
|
2.28
|
9.21
|
|
5.74
|
|
Phenylalanine
|
2.58
|
9.24
|
|
5.91
|
|
Proline
|
1.99
|
10.60
|
|
6.30
|
|
Serine
|
2.21
|
9.15
|
|
5.68
|
|
Threonine
|
2.15
|
9.12
|
|
5.60
|
|
Tryptophan
|
2.38
|
9.39
|
|
5.88
|
|
Tyrosine
|
2.20
|
9.11
|
10.07
|
5.63
|
|
Valine
|
2.29
|
9.74
|
|
6.02
|
First we need to know the abbreviations of the amino acid. Y is Tyrosine, K is Lysine, V is Valine, etc. This can be found by just googling it or looking it up in your textbook. It is easier to just memorize it so you don't have to always look it up.
Second you will want to draw out the structure but this is not necessary but it can be useful. Read the article on "How to draw amino acids" if you don't know how to do this.
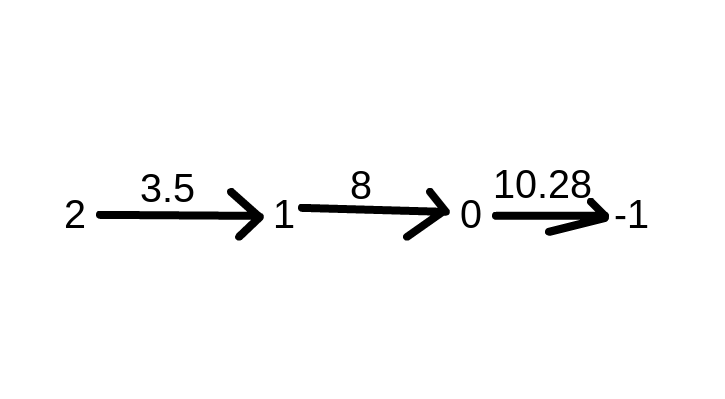
Now that you have drawn the amino acids, you want to figure out the total max positive charge and total max negative of your protein. Lysine and Arginine have positive charges. The amine group also has a positive charge. Glutamic and Aspartic acid have negative charge. Carboxy terminus also has a negative charge. So this protein has a positive charge of +2 because of the lysine and the amine group. And the protein can have a maximum negative charge of -1 because of the carboxy terminus. So the protein will have charges between +2 and -1.
Next you want to order the pK lowest to greatest when transitioning between the charges. Lysine pK side group of 10.28 has Amine(NH2) groups usually have 3.5-4 pKa and carboxy groups usually have pKa of 8.
So it should look like this

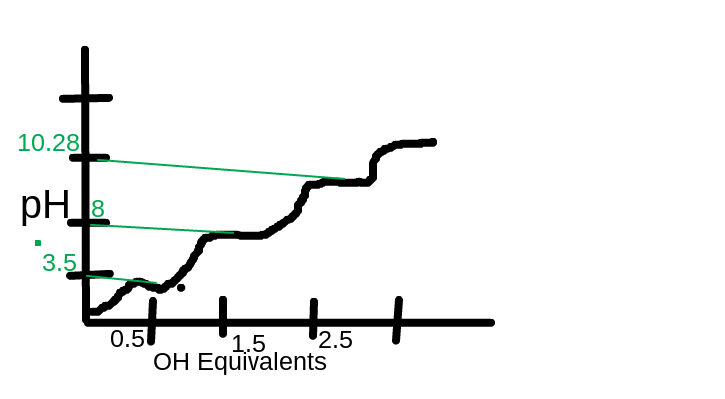
Now that you can draw your titration curve. The X-axis will have OH- equivalents and the Y axis will be your pH. The first pK of 3.5 will be at the 0.5 OH- equivalent and the next pK of 8 will be at 1.5 OH- and the 10.28 pK will be at the 2.5 OH. To find the isoelectric point or pI you take the sum of the two pK that give neutral charge which are 8 and 10.28 and divide by two to get pI of 9.14. Finally you can draw your titration curve with the given information that the flat lines between the humps are the pK values. Your titration chart should look something like this.

I drew the green lines to show where the pH of the pK matching up with the OH equivalents.
|